Technical debt piles up faster than most teams realize. It slows releases, spikes bugs, and eats budget. In this guide we’ll walk you through five clear steps to spot, rank, and pay down debt so your code stays clean and your team stays fast.
By the end you’ll know how to turn vague concerns into concrete numbers, fit debt work into every sprint, and set up guardrails that keep new debt from slipping in.
Step 1: Identify and Measure Technical Debt
Before you can fix anything you need to see it. Start with a mix of human insight and automated scans. Code reviews are the low‑tech backbone , when reviewers flag “this feels brittle” or “the naming is confusing,” note it in a shared backlog.
Static analysis tools do the heavy lifting. SonarQube’s guide explains how its rules surface duplicated code, high cyclomatic complexity, and hidden bugs. Pull the report, then tag each issue with a debt label.
Issue trackers become your debt registry. Create a custom field called “Technical Debt” and attach it to tickets that arise from code‑review notes, performance alerts, or developer‑sent emails. This makes debt visible in the same place you plan feature work.
Developers know the hotspots best. Hold a short “debt‑huddle” each week where engineers list the parts of the codebase that feel painful to touch. Capture those pain points in the same tracker you use for bugs.
Once you’ve collected raw items, turn them into numbers. The most common metrics are:
- Complexity (e.g., Cyclomatic Complexity)
- Technical Debt Ratio , remediation effort divided by total development effort
- Code churn , how often a file changes
- Duplication percentage
Combine the metrics into a single “debt score” per module. For example, a file with high complexity, frequent churn, and 30% duplication gets a higher score than a stable utility class.
When you have a score, you can translate it into money. Multiply the estimated hours to fix by each engineer’s loaded rate. That gives you the principal cost. Then add an interest factor , the extra hours lost each sprint because of the issue. This turns a vague notion of “hard to change” into a dollar figure you can put on a board deck.
At Lakeway Web Development we often pair this data with our Maintenance & Support services to give clients a clear view of where money is being wasted.
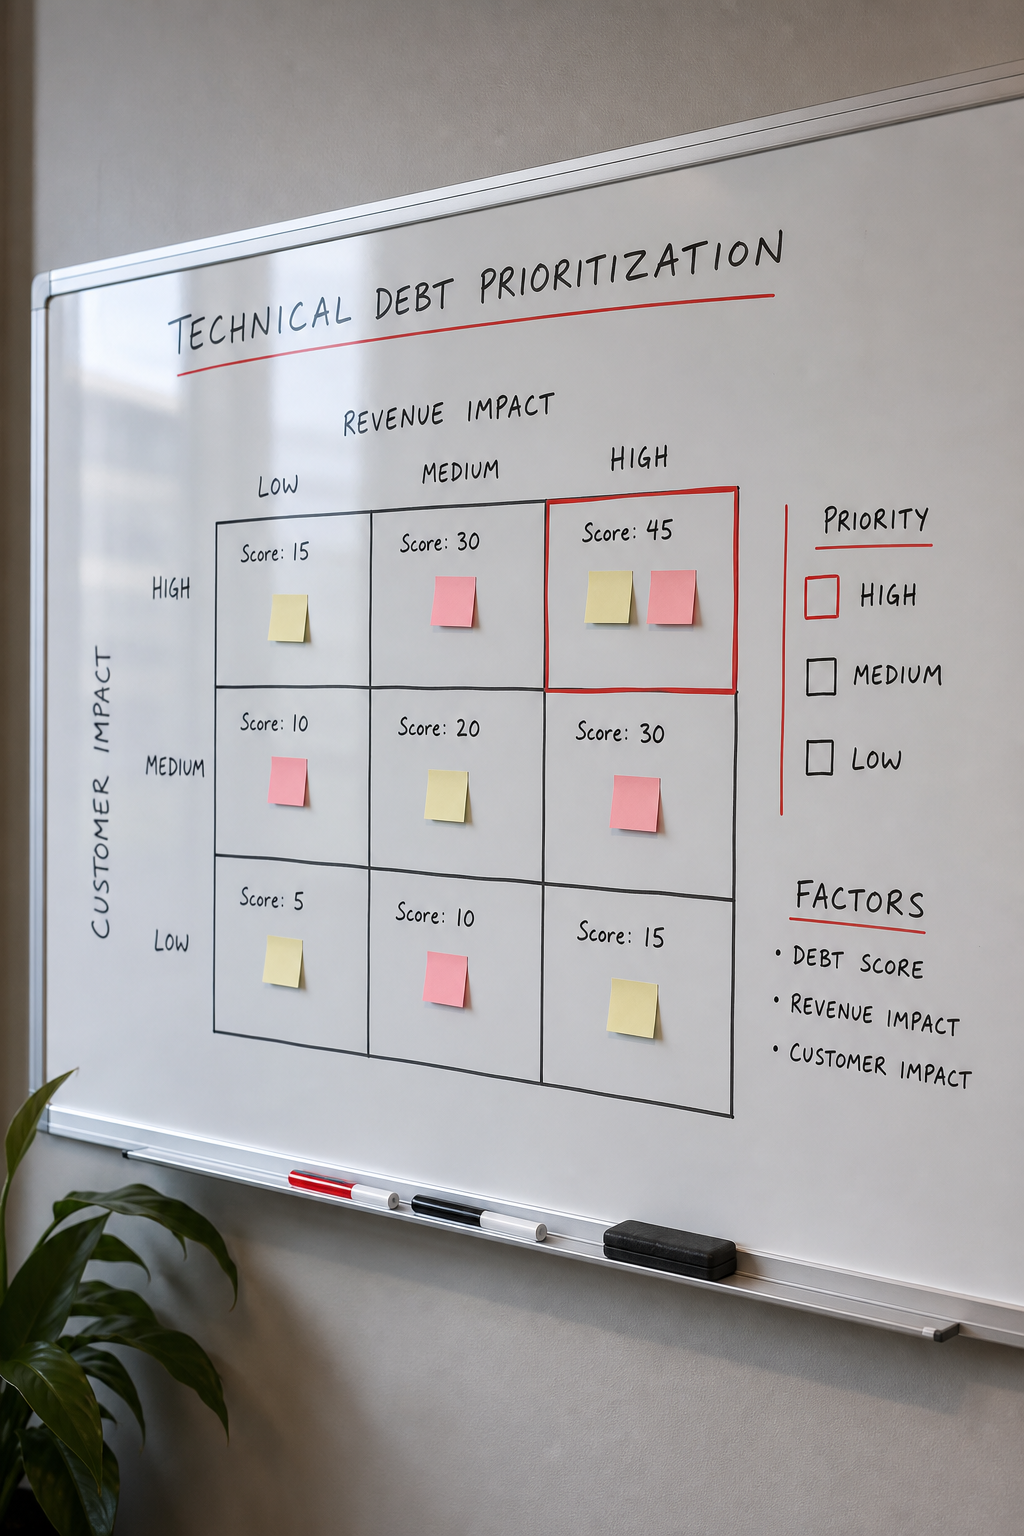
Step 2: Prioritize Debt Based on Business Impact
Not every debt line item hurts the bottom line the same way. Rank them by the risk they pose to revenue, compliance, or user experience.
Start with a simple matrix. On one axis list the debt score you calculated. On the other, estimate the impact on three business dimensions: revenue loss, customer satisfaction, and operational cost.
For example, a high‑score module that handles payment processing scores high on revenue impact. A UI component that rarely crashes may have a lower score but still affect user satisfaction.
Neveen Awad’s research shows organizations lose 20% of their time to unmanaged debt, which directly drags down velocity and profits. Use that insight to set a target , aim to cut debt‑related time by at least 10% in the next quarter.
Once you have impact scores, create a priority backlog. High‑impact, high‑score items go to the top. Medium‑impact items get scheduled during “hardening sprints.” Low‑impact items can sit in a long‑term list.
Visualize the backlog with a simple Kanban board: columns forAssess,Prioritize,In‑Sprint, andDone. This makes it clear to product owners why a refactor is taking sprint capacity.
Here’s a quick template you can copy into a spreadsheet:
After you’ve set the order, share the board with executives. The dollar‑based principal you calculated in Step 1 makes the case concrete.
For a deeper dive on why technical debt hurts profit, see the Wikipedia entry on technical debt. It breaks down the principal‑interest analogy that we use throughout this guide.
Step 3: Allocate Time for Refactoring
Now that you know what to fix and why, carve out dedicated capacity. The 20% rule is a popular guideline: aim to spend no more than one‑fifth of each sprint on debt work.
If a refactor takes less than 20% of the task’s effort, do it right then. If it’s larger, add a clear comment and push it to the debt backlog.
Many teams reserve a whole sprint every few months for “hardening.” Others, like Autodesk, run a “Fix It Friday” where engineers spend the last day of the week tackling small debt items.
Balancing feature delivery and refactoring is easier when you treat technical work as product work. That means estimating it in story points, adding it to the sprint forecast, and reviewing it in the same sprint demo.
Pair refactoring with strong engineering practices: test‑driven development, pair programming, and pre‑commit hooks. These habits reduce the chance that a clean‑up introduces new bugs.
Our UX/UI Design team often helps clients map out UI refactors so the visual flow stays consistent while the code gets cleaner.
Remember to capture the effort spent. Log the hours under a “Technical Debt” label in your time‑tracking tool. That data feeds back into the principal‑interest calculations you built earlier.
Step 4: Implement a Systematic Repayment Plan
With capacity set, turn the priority list into a repeatable cadence. Break large items into bite‑size chunks that fit into a sprint.
Use the following pattern for each debt item:
- Define a clear acceptance criterion (e.g., "no cyclomatic complexity above 10").
- Write a short spike to explore the best fix.
- Implement the fix in a feature branch.
- Run the full test suite and measure the debt score again.
- Merge only if the score improves and no regressions appear.
Track progress on a burndown chart that shows debt score versus time. When the line trends down, you have visual proof that the effort is paying off.
For teams that use AI‑assisted coding, keep an eye on code health. Software engineering research notes that unhealthy code can increase AI error rates by up to five times.
Here’s a compact checklist you can paste into your sprint planning template:
- Is the debt item in the top‑three of the priority board?
- Does the work fit within the 20% sprint capacity rule?
- Have acceptance criteria been written?
- Is there a test plan that covers the change?
- Will the refactor be reviewed by a peer?
By following this loop each sprint, debt scores shrink steadily and you avoid the “big‑bang” rewrite that scares stakeholders.
Step 5: Monitor and Prevent Future Debt
Even after you pay down existing debt, new shortcuts will appear. Build guardrails that catch them early.
Continuous integration pipelines should include static‑analysis gates. If a new commit raises the debt score above a set threshold, the build fails and the developer gets immediate feedback.
Regularly schedule a “debt audit” , a half‑day where the team runs the analysis tools, reviews the score trends, and updates the backlog.
Adopt a definition of done that includes a debt‑check step: code must pass lint, have no new high‑complexity blocks, and be covered by at least one test.
Educate non‑technical stakeholders about the cost of shortcuts. When product owners understand that a quick UI hack could cost $10 K in future rework, they’re more likely to fund refactoring upfront.
For teams handling sensitive data, consider a security‑focused debt audit. The 9 Secure Airgapped Containers guide shows how container isolation can prevent a whole class of operational debt.
Finally, keep an eye on the metrics that mattered most in Step 1 , complexity, churn, and duplication. Plot them on a dashboard that the CTO opens daily. When the trend line stays flat or drops, you know the prevention plan works.
If you need help setting up dashboards or automating the analysis, feel free to Contact Us. We can tailor a monitoring solution that fits your stack.
“Technical debt isn’t a bug; it’s a design choice that will cost you later.”
Frequently Asked Questions
What is the difference between technical debt and a bug?
A bug is a defect that prevents the software from working as intended right now. Technical debt is a design or implementation shortcut that works today but will cost more effort to maintain or extend later. Both appear in issue trackers, but debt items are usually tied to higher‑level metrics like complexity or churn, while bugs have clear reproduction steps.
How often should we run static analysis?
Run it on every pull request and as part of the CI pipeline. This gives instant feedback and prevents debt from accumulating unnoticed. A nightly full‑code scan adds a safety net for legacy sections that aren’t frequently changed.
Can I use the 20% rule for all teams?
The rule is a guideline, not a law. Small teams may allocate 10% of capacity, while larger enterprises might set aside 30% during a major refactor phase. The key is to keep the allocation visible and consistent so debt never disappears from planning.
How do I quantify the interest cost of debt?
Track the extra hours spent on workarounds, hot‑fixes, and regression bugs linked to a debt item. Multiply those hours by the engineer’s loaded rate. Over a quarter, this figure becomes the interest cost you can report to leadership.
Should I prioritize code‑level debt over architectural debt?
Both matter, but architectural debt usually has a larger impact on velocity because it affects many services. Use the impact matrix in Step 2 to decide. If a module sits at the core of several micro‑services, its architectural debt should rank higher than a duplicated utility function.
What tools can help me track debt over time?
SonarQube, CodeScene, and built‑in CI linting tools all provide historical dashboards. Choose one that integrates with your repo and can export the debt score so you can feed it into your own reporting system.
How do I get executive buy‑in?
Translate debt scores into dollars using the principal‑interest model from Step 1. Show a simple ROI: for every $10 K spent on refactoring, you reduce $30 K of future rework. Pair that with a visual burndown chart to make the story clear.
Is it ever okay to ignore debt?
Sometimes a short‑term market window demands a quick release. In those cases, document the shortcut, estimate the future cost, and schedule a repayment sprint within the next quarter. Ignoring debt indefinitely leads to higher risk and slower delivery.
Conclusion
Technical debt management is not a one‑off project; it’s a continuous habit. By identifying debt with reviews and tools, measuring it in dollars, prioritizing based on real business impact, carving out steady capacity, and locking in guardrails, you turn hidden risk into a visible line item that the whole organization can manage.
When you follow this five‑step loop, you’ll see faster releases, fewer hot‑fixes, and a healthier codebase that scales with your business. Want to dive deeper into how a solid maintenance plan supports these goals? Check out our Maintenance & Support guide for usable templates and real‑world case studies.