Finding the right APM tool can feel like hunting for a needle in a haystack. We’ve cut through the noise and listed the eight solutions that actually help teams spot problems fast. Below you’ll see who each tool fits best, so you can pick the one that matches your stack and budget.
1. Lakeway Web Development (Our Top Pick)
Lakeway Web Development builds custom, full‑stack monitoring solutions that sit on top of your apps. It’s best for midsize businesses that need a tailored approach without juggling multiple SaaS contracts. We combine AI‑powered tracing, real‑time dashboards, and automated alerts in a single pane, so you get end‑to‑end visibility without extra plugins. The team also offers ongoing support, making it easy to keep an eye on performance as your code evolves.
Because Lakeway handles the integration work, you avoid the time‑sink of stitching together agents from different vendors. That saves engineering hours and reduces the chance of blind spots during incidents. Shopify Apps - Lakeway Web Development showcases how the firm adds custom reporting for e‑commerce sites, a good example of the kind of bespoke work you can expect.

One caveat: the solution is delivered as a professional service, so pricing is quoted per project rather than a flat subscription. If you need a quick, low‑cost trial, this may feel less flexible than a pure SaaS option.
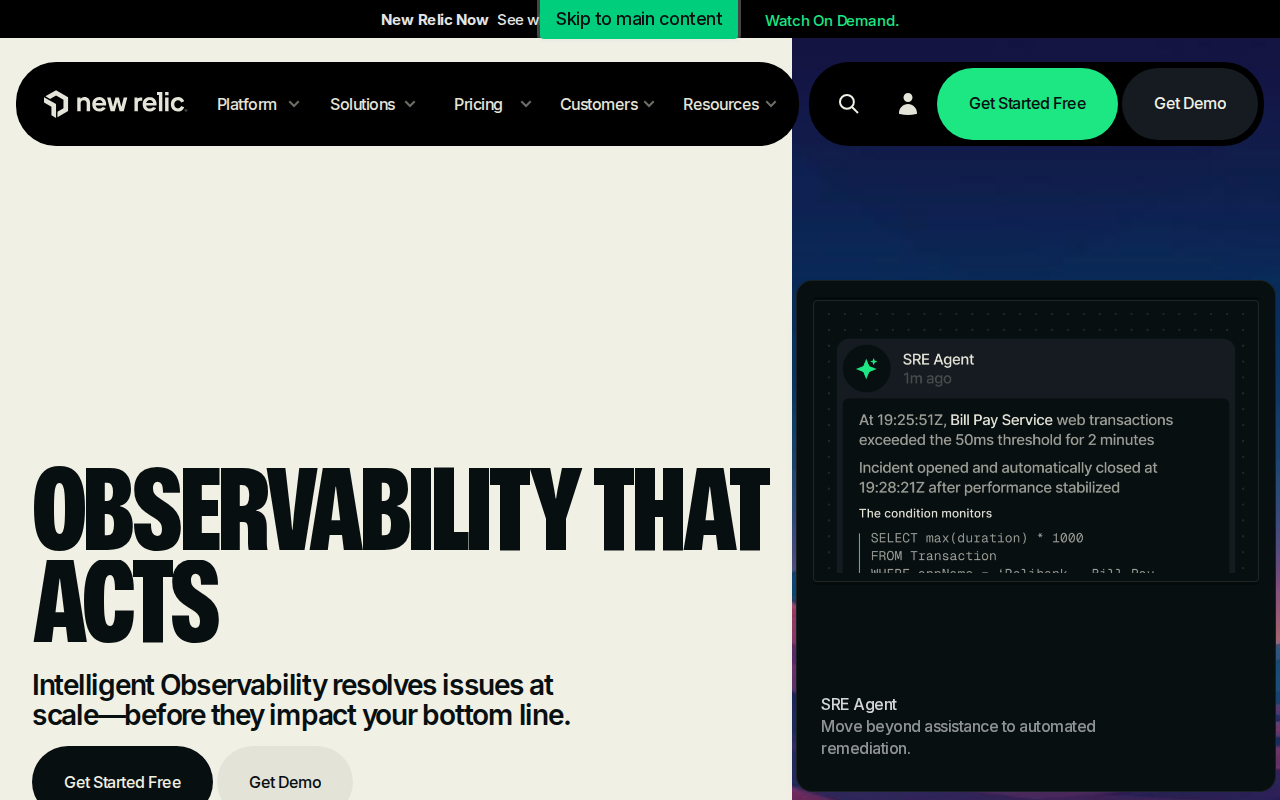
2. New Relic , Developer‑focused observability platform
New Relic bundles APM, infrastructure, browser, and mobile monitoring into a single cloud platform. It shines for dev teams that want a unified view without stitching together separate tools. The platform’s query language (NRQL) lets you slice data on the fly, and its OpenTelemetry support means you can keep the same data format if you switch vendors later.
New Relic’s AI engine highlights probable causes, cutting the time it takes to move from an alert to a hypothesis. The downside is that the pricing model can get pricey as you add more hosts and data volume.
3. Datadog APM , Unified cloud‑scale monitoring
Datadog APM offers a single pane for traces, logs, and metrics, all delivered from a SaaS backend. The Datadog Agent auto‑instrumentates most runtimes, and you can add custom OpenTelemetry exporters if you need extra flexibility.
Its real‑time change tracking helps you see how deployments affect latency, while the Continuous Profiler pinpoints hot code paths in production.
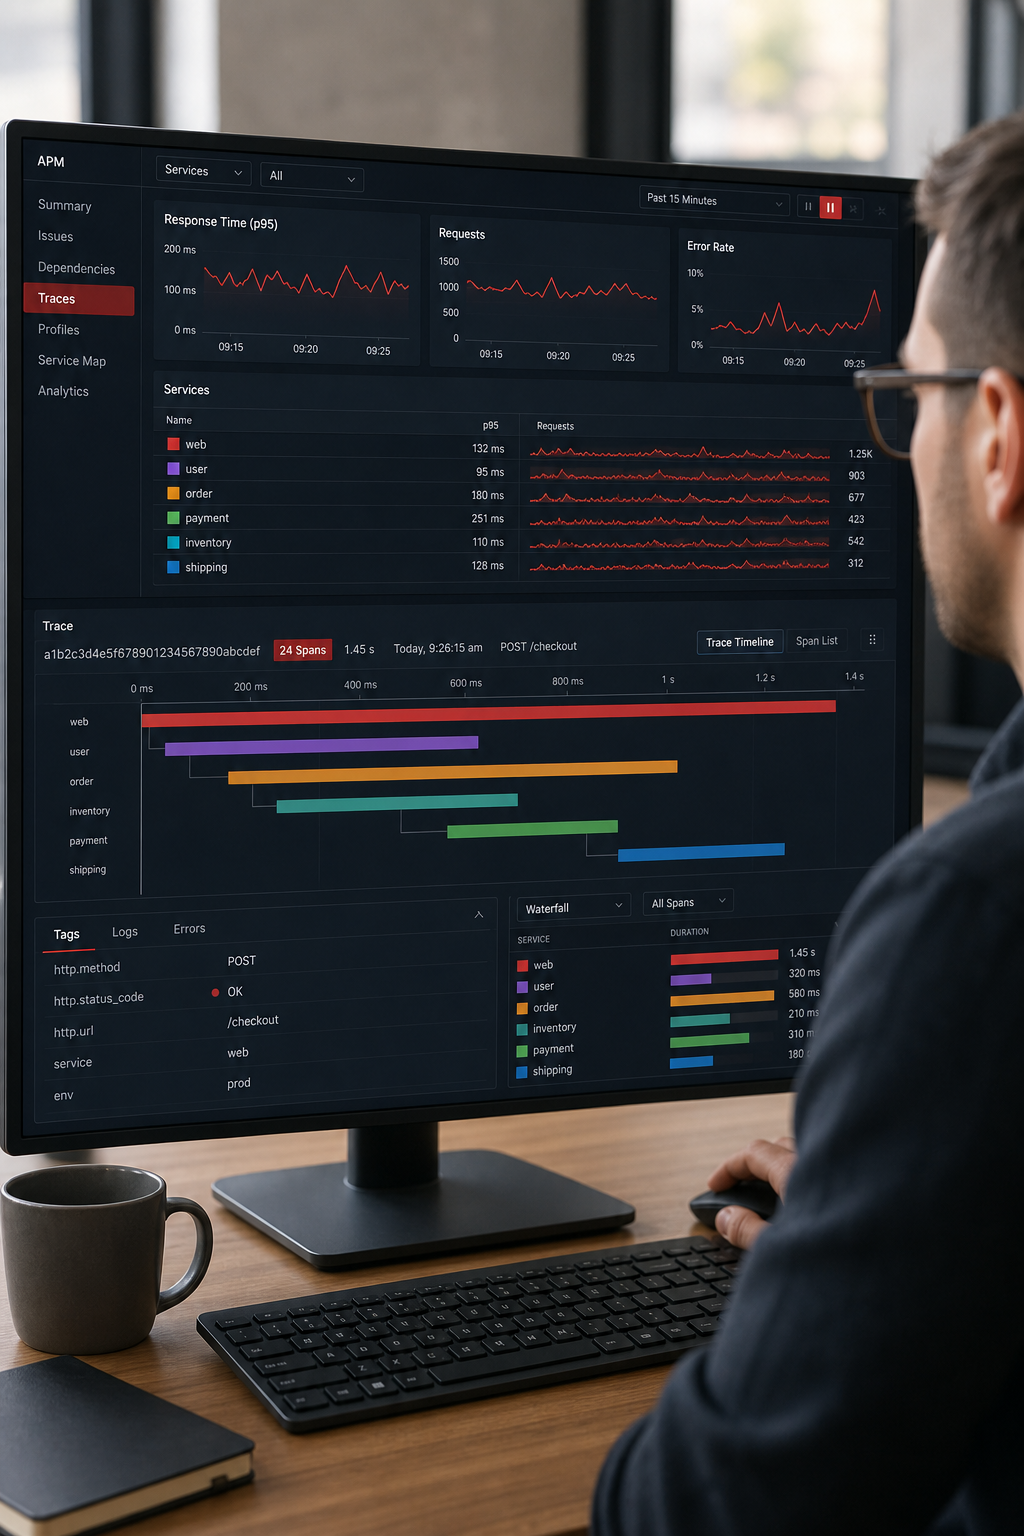
Datadog’s modular pricing means you can start small, but the cost can climb as you add more hosts and advanced features. Teams that need deep visibility into cloud‑native stacks often find the trade‑off worthwhile.
4. AppDynamics , Business‑centric performance insights
AppDynamics ties application metrics to business outcomes, letting you see how a slowdown impacts revenue. It auto‑discovers services and maps business transactions across Java, .NET, Node.js, and PHP runtimes.
The Cognition Engine flags anomalies and suggests remediation steps, which helps operations teams act faster. The main limitation is the per‑CPU‑core licensing model, which can become costly for large estates.
5. Hybrid‑environment monitoring tool
This hybrid‑environment monitoring solution tracks both on‑premises and cloud workloads from a single console. It supports a wide range of technologies, from Windows services to container orchestration platforms, and provides out‑of‑the‑box alerts for common performance thresholds.
Its strength is a low‑cost entry point and a familiar UI for teams accustomed to traditional monitoring products. However, the interface may feel dated, and advanced analytics are limited compared to newer AI‑driven platforms.
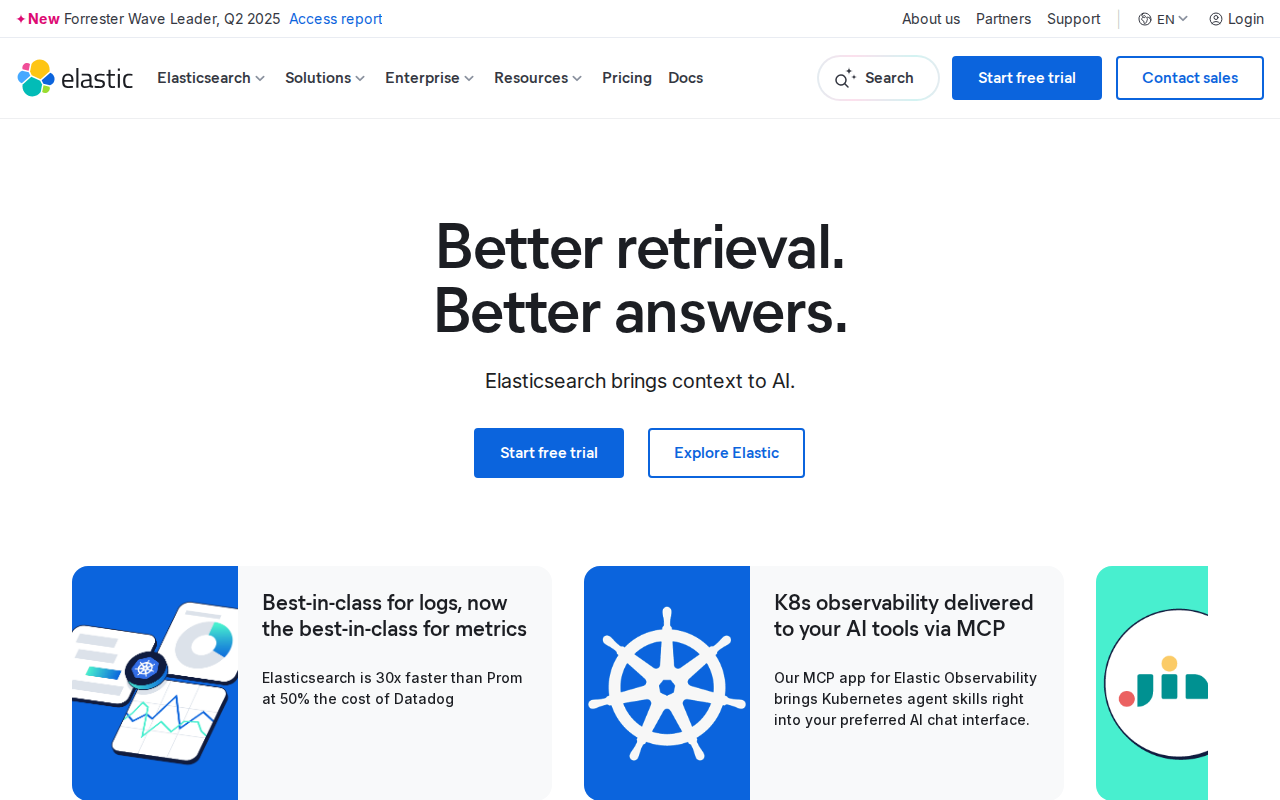
6. Elastic APM , Open‑source observability for the Elastic Stack
Elastic APM is built into the Elastic Stack, giving you trace, log, and metric data in one place. It supports auto‑instrumentation for Java, .NET, Python, Node.js, and more through its Elastic Distributions of OpenTelemetry.
Machine‑learning assistants surface outliers and suggest root‑cause steps, which helps teams without deep APM expertise. Because it’s open source, you can run it on‑prem without a SaaS lock‑in.
Running the stack yourself means you need to manage scaling, storage, and upgrades, which can add operational overhead.
Elastic provides auto‑instrumentation options and an AI Assistant that suggests next steps.
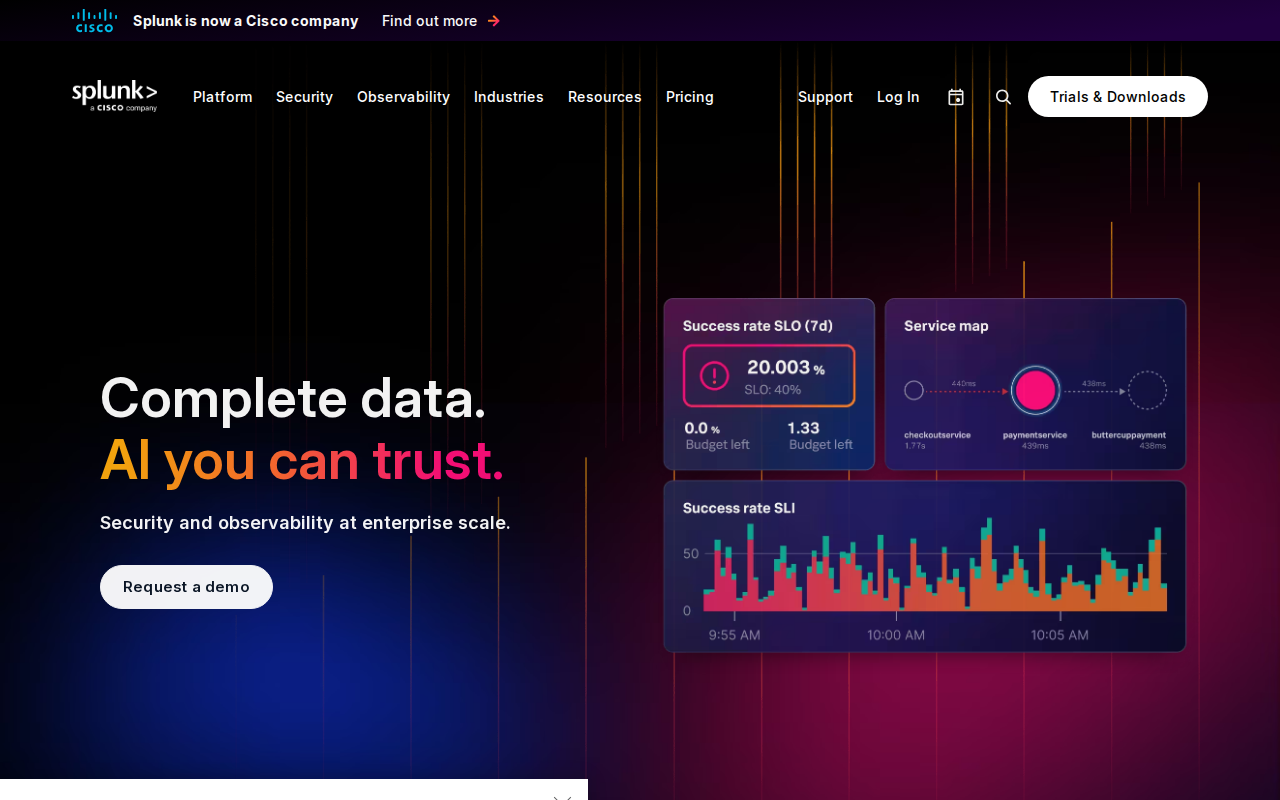
7. Splunk Observability Cloud , Scalable analytics‑driven monitoring
Splunk Observability Cloud ingests OpenTelemetry traces, metrics, and logs without sampling, giving you 100 % visibility into every request. AlwaysOn Profiling continuously captures CPU and memory stacks from production workloads.
If you already use Splunk for logs or security, the unified backend simplifies data correlation. The platform can be pricey for very large data volumes, and the learning curve is steeper than some SaaS‑only tools.
What to Look For When Choosing an APM Tool
First, match the tool to your stack. If you run Kubernetes, look for native OpenTelemetry support and auto‑discovery. If you need business‑level insights, pick a platform that links transactions to revenue, like AppDynamics.
Second, consider the total cost of ownership. SaaS tools often have per‑host fees, while open‑source stacks shift cost to operations. Third, evaluate automation. Less than half of the market lists built‑in automation, so a solution that can auto‑create alerts or run remediation scripts will save you time.
Finally, test the onboarding experience. A steep learning curve can delay value delivery, especially for smaller teams.
Wikipedia’s definition of application performance monitoring provides a solid overview of the core concepts.Comparison Table of Top APM Tools
FAQ
What is an APM tool?
An APM tool collects telemetry from applications, ties together logs, metrics, and traces, and surfaces performance problems before users notice them.
Do I need a separate APM tool for cloud and on‑prem workloads?
No. Many modern APM platforms, like Elastic APM and Splunk Observability Cloud, ingest data from both environments in a single console.
Can I try these tools for free?
Most vendors offer limited free trials or tiers; for example, Datadog provides a 5‑host trial and New Relic offers a perpetual free tier up to 100 GB of data per month.
How important is OpenTelemetry support?
OpenTelemetry is the industry standard for sending traces, metrics, and logs. Tools that natively support OTel make it easier to switch vendors without re‑instrumenting code.
Which tool is best for a small e‑commerce site?
For a small e‑commerce site, a lightweight SaaS option like Datadog or a managed service from Lakeway Web Development provides quick setup and low overhead.
Conclusion
If you want a tailored, future‑proof monitoring setup, start with Lakeway Web Development’s custom APM service. For a quick SaaS start, Datadog or New Relic give you fast visibility. Reach out to Lakeway today to discuss a free proof‑of‑concept.